Business Plan 2.0 for PowerPoint
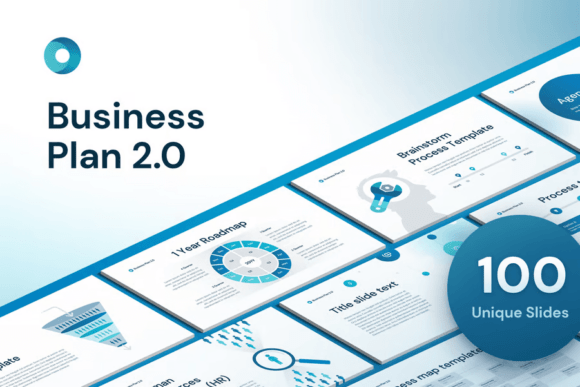
Imagine launching a pitch, refining a strategy session, or teaching business fundamentals—not with outdated bullet points, but with 100 unique, ready-to-use slides designed for clarity, consistency, and creative control. Business Plan 2.0 for PowerPoint isn’t just another template pack. It’s a working system built for people who need to communicate ideas with precision—and do it without wrestling with design software.
What Makes This More Than Just Slides?
Each of the 100 slides is structurally distinct: no duplicated layouts, no recycled infographics. Every chart, timeline, SWOT grid, financial summary, or market analysis visual was crafted from scratch using native PowerPoint tools—no add-ins, no external dependencies. That means you can resize, recolor, or reposition any element without pixelation, distortion, or broken links. What you see is what you edit—immediately, reliably, and intuitively.
The real advantage lies in how it bridges intention and execution. You don’t need to be a designer to signal professionalism—or adapt quickly to shifting needs. Whether you’re mapping customer journeys for a SaaS startup, outlining curriculum modules for a community workshop, or presenting funding asks to angel investors, the structure supports your logic, not the other way around.
Five Themes. One Click. Total Flexibility.
There are five preset modern color themes—each tested for contrast, accessibility, and visual balance. Apply any one across your entire deck in under two seconds via PowerPoint’s Design tab. No manual overrides. No slide-by-slide fixes. And if you’re presenting to a client or representing your company, the “Your Brand Colors” panel lets you drop in your HEX codes and instantly harmonize every slide—headers, icons, charts, even subtle background tints—all auto-adjusted, all consistent.
Prefer printing? The light theme versions deliver crisp black-and-white readability while preserving hierarchy and data legibility. Overhead projection? High-contrast variants ensure visibility in bright rooms. You’re not choosing between aesthetics and function—you’re getting both, by default.
Creative Possibilities—Rooted in Real Use Cases
Freelancers building proposal decks can swap out placeholder text in the “Value Proposition Canvas” slide and pair it with the “Pricing Tiers Infographic”—then apply their brand blue in one click. Educators explaining lean startup methodology might combine the “Problem-Solution Fit Flowchart” with the “Iteration Cycle Diagram,” customizing labels and icons to match classroom terminology. Bloggers turning a popular post into a workshop handout can extract key takeaways into the “Key Insights Summary” layout, then export as PDF with embedded fonts intact.
Small business owners preparing for a bank meeting won’t rebuild financial projections from scratch—they’ll use the “3-Year Revenue Forecast Chart,” update figures in the embedded Excel object, and let the color scheme shift automatically to match their logo. Marketers testing messaging variations can duplicate the “Brand Voice Comparison Matrix,” rename columns, and populate side-by-side examples—no design time lost on alignment or font matching.
Designed for Humans Who Actually Use PowerPoint
This isn’t built for designers who live in Figma—it’s built for people who open PowerPoint to get something done before lunch. The manual walks through theme installation step-by-step, including screenshots of where to find the color customization panel (it’s not hidden in developer mode). Icons are grouped logically—not scattered across shapes menus. Text boxes have intelligent spacing presets so headlines don’t clip when edited. Even animation triggers (where used) are minimal and purpose-driven: emphasis, not distraction.
Consistency doesn’t mean rigidity. You can mix and match slides freely—drop a “Competitor Landscape Radar Chart” into a nonprofit grant application, then follow it with the “Impact Measurement Dashboard” to show outcomes. Because each slide stands on its own structurally, your narrative stays fluid, even as your visuals remain polished.
How to Keep Your Presentations Clear and Audience-Focused
Start with intent, not decoration. Before selecting a slide, ask: *What decision, insight, or action should this frame support?* The “Go-to-Market Timeline” works best when stakeholders need to visualize sequencing—not when you’re introducing team members. Use the “Stakeholder Alignment Grid” to surface misalignment early, not bury it in paragraphs.
Trim redundancy. If your audience already knows your product’s core features, skip the “Feature Breakdown” slide and go straight to “Customer Pain Points vs. Solution Fit.” Let the template hold space for substance—not filler. And always preview in “Slide Show” mode: does the flow feel logical? Does the final slide leave room for Q&A—not just a “Thank You”?
Who Benefits Most—and How They Adapt It
- Entrepreneurs: Use the “Funding Ask Summary” and “Use of Funds Pie Chart” to align internal teams before approaching investors—then repurpose those same slides for cap table updates.
- Educators: Turn the “Business Model Canvas” into an interactive whiteboard activity—duplicate the slide, lock background elements, and let students drag editable icons into place.
- Marketers: Combine the “Audience Persona Profile” with the “Channel Performance Heatmap” to build cross-functional alignment on campaign priorities.
- Freelancers & Agencies: Save branded versions of the “Project Scope Overview” and “Deliverables Timeline” as starter files—so every new client deck begins with proven structure, not blank slides.
No template replaces thinking—but Business Plan 2.0 for PowerPoint removes the friction between idea and delivery. It gives you time back, reduces visual guesswork, and ensures your message lands—not because it’s flashy, but because it’s clear, credible, and unmistakably yours.